Monday, October 1, 2018

FAQs


This post contains email questions and my answers


A Malpighian body has two components- the glomerulus (a tuft of capillaries formed by the afferent arteriole) and the Bowman's capsule (a double-walled epithelial cup that encloses the glomerulus. Filtration occurs if the outward driving pressures exceed the inward reabsorption pressures. This balance is quantified by the Starling equation.

  • Overview
    • As mentioned, the rate of glomerular filtration is essentially governed by Starling Forces. However, because the glomerular capillaries are surrounded by the fluid in the Bowman's Capsule, the hydrostatic and oncotic pressure of Bowman's Space is used instead of those of the 'Interstitial Fluid'. Importantly, because no plasma proteins can cross the glomerular barrier during glomerular filtration, the oncotic pressure of fluid in Bowman's Space is essentially zero and is thus removed from the starling equation.
  • Formally:
    • GFR = Kf [(Pc-Pb)-(Πc)]
    • GFR = Glomerular Filtration Rate (ml/min). Equivalent of Jv in Starling Forces
    • Kf = Permeability Constant of glomerular capillaries
    • Pc = Glomerular Capillary Hydrostatic Pressure
    • Pb = Bowman's Space Hydrostatic Pressure
    • Πc = Glomerular Capillary Oncotic Pressure

Physical determinants of the glomerular filtration rate
The Glomerular Filtration Rate (GFR) is a quantitation of the volume of fluid filtered through the glomerular barrier per unit time. The GFR is essentially determined by a special case of the starling equation and is given above. The primary physiological modulators of GFR are the afferent and efferent arteriolar resistances (RA and RE). As expected, increasing the afferent arteriolar resistance (RA) drops the pressure within the glomerulus and thus reduces GFR. The relationship between the efferent arteriolar resistance (RE) and GFR is more complicated. Initially, increasing RE boosts the pressure within the glomerulus and thus increases GFR. However, at higher values of RE the total blood flow through the glomerulus decreases and thus GFR drops.


What is the difference between homeostasis and adaptation?


I think you meant homeostasis instead of hemostasis. Homeostasis is the concept of animals maintaining a constant internal environment even when the external environment and/or stress factors or injury are present. Adaptation refers to how homeostasis is accomplished. Two examples:

1 Blood pressure is maintained within a narrow range of values even when there is a sudden change in gravity; e.g., when you rapidly stand up. The mechanisms that allow this adaptation are a baroreceptor reflex (rapid) and hormonal changes driven by renin produced in the kidneys (slow).

2 Arterial oxygen content is maintained at a normal value (20 mlO2/dL blood) even after you move from sea level to high altitude. The mechanisms that allow this adaptation are increased lung ventilation (rapid) and increased red blood cells driven by erythropoietin produced by the kidneys (slow).


Dr. Wood,


I understand that M3 receptors are located in MANY places in our body (especially smooth muscle)… including our endothelial cells (in which they activate NO synthesis -> diffusion into smooth muscle -> cGMP production -> relaxation.


However, how do circulating catecholamines (e.g. from a pheochromocytoma) circulating in our bloodstream ultimately get to exert their effect on smooth muscle adrenergic receptors?  To my knowledge, there are no adrenergic receptors on our endothelial cells and from what I can remember, the only way smooth muscle contracts/relaxes in response to catecholamines is via neuronal synapses.  I feel like I’m missing something here…


Beta-adrenoceptor agonists (β-agonists) bind to β-receptors on cardiac and smooth muscle tissues. They also have important actions in other tissues, especially bronchial smooth muscle (relaxation), the liver (stimulate glycogenolysis) and kidneys (stimulate renin release). Beta-adrenoceptors normally bind to norepinephrine released by sympathetic adrenergic nerves, and to circulating epinephrine. Therefore, β-agonists mimic the actions of sympathetic adrenergic stimulation acting through β-adrenoceptors. Overall, the effect of β-agonists is cardiac stimulation (increased heart rate, contractility, conduction velocity, relaxation) and systemic vasodilation. Arterial pressure may increase, but not necessarily because the fall in systemic vascular resistance offsets the increase in cardiac output. 

Blood vessels

Vascular smooth muscle has β2-adrenoceptors that have a high binding affinity for circulating epinephrine and a relatively lower affinity to norepinephrine released by sympathetic adrenergic nerves.
Increased intracellular cAMP by beta-2-agonists inhibits myosin light chain kinase thereby producing relaxation

These receptors, like those in the heart, are coupled to a Gs-protein, which stimulates the formation of cAMP. Although increased cAMP enhances cardiac myocyte contraction (see above), in vascular smooth muscle an increase in cAMP leads to smooth muscle relaxation. The reason for this is that cAMP inhibits myosin light chain kinase that is responsible for phosphorylating smooth muscle myosin. Therefore, increases in intracellular cAMP caused by β2-agonists inhibits myosin light chain kinase thereby producing less contractile force (i.e., promoting relaxation).


Hi Dr. Wood,

Could you please explain why there is oliguria in Nephritic syndrome?


 Mechanisms of oliguria and acute kidney injury. Multiple mechanisms can potentially cause oliguria in the acutely injured kidney. Regional intrarenal differences in blood flow and redistribution; glomerular injury or altered intraglomerular hemodynamics; impaired tissue oxygenation causing preferential ischemia to the S 3 segment of the proximal convoluted tubule and the oxygen-avid thick ascending loop of Henle; loss of osmolar gradient, interstitial edema, or inflammation; and tubular or lower urinary tract obstruction can precipitate oliguria. CCD and MCD, cortical and medullary collecting ducts; Osm, osmolality; p t O 2 , tissue partial pressure of oxygen; Q B , renal blood flow; S 1 – S 3 , segments of the proximal convoluted tubule; TALH, thick ascending loop of Henle. 

   
We are in MSK but I’ve come across a topic I’m lost in. I’m going over NSAID pharmacology and am struggling to understand the mechanism behind hyperkalemia associated with their use. From my understanding, the use of NSAIDs will block dilation of the renal afferent arteriole which would lead to a drop in GFR. I was under the impression that the kidney would sense this and would subsequently hype up the RAAS which would increase sodium and excrete potassium and H+ ions. However, this is clearly not the case as you see a Hyper- rather than Hypo- kalemia with certain NSAID use.

Do you happen to know the mechanism behind this?


Here is what I found that makes pretty good sense.  renal prostaglandins dilate both afferent and efferent arterioles (see nephron map
)

NSAIDs: Electrolyte complications
Author:
Richard H Sterns, MD
Section Editor:
Michael Emmett, MD
Deputy Editor:
John P Forman, MD, MSc
INTRODUCTION
Nonsteroidal antiinflammatory drugs (NSAIDs) are the most commonly prescribed analgesics worldwide. These agents reduce pain, inflammation, and fever by inhibiting cyclooxygenase (COX), which results in decreased synthesis of prostaglandins. COX has two isoforms; inhibition of COX-1 is responsible for the gastrointestinal side effects of NSAIDs, while their desired antiinflammatory effects are due to inhibition of COX-2 [1
]. The COX-2 isoform is constitutively present in the kidney, and, therefore, both nonselective NSAIDs and more selective COX-2 inhibitors reduce renal prostaglandins. (See "NSAIDs: Pharmacology and mechanism of action"
.)
Renal vasodilatory prostaglandins promote the secretion of renin, impair sodium reabsorption in the loop of Henle and cortical collecting tubule, and partially antagonize the ability of antidiuretic hormone (ADH) to increase water reabsorption in the collecting tubules [2-5

]. Locally generated prostaglandins also may mediate part of the natriuretic effect of dopamine and of natriuretic peptides [6,7
].
These actions are not of major importance in normal subjects in whom basal renal prostaglandin production is relatively low. However, they may become clinically significant when prostaglandin synthesis is stimulated by underlying renal disease or by the vasoconstrictors angiotensin II or norepinephrine. Secretion of these vasoconstrictors is increased in states of effective volume depletion: true volume depletion due to gastrointestinal or renal losses (as with diuretic therapy) or reduced tissue perfusion due to heart failure or cirrhosis.
In the setting of effective volume depletion, NSAIDs, which inhibit prostaglandin synthesis, can produce a variety of complications related to renal dysfunction, each of which is reversible with discontinuation of therapy [2,3

]. These include hyperkalemia, hyponatremia, and edema. These complications are mediated in part by reductions in the secretion of renin and aldosterone and by increased activity of ADH [2,3,8
].
another good article is here

How does hypoxia cause constriction of pulmonary arteries?

In pulmonary arteries, hypoxia causes a triphasic response ending with a sustained phase of contraction52 and is termed “hypoxic pulmonary vasoconstriction”. This phenomenon is observed in isolated systemic or pulmonary arteries across many species including reptiles, birds and mammals53,54. Its physiological role is to adjust the ventilation/perfusion ratio by diverting blood to regions of the lung with adequate oxygen supply55. However sustained hypoxic constrictions may lead to pulmonary hypertension; the latter is a dramatic pathological situation still in search of an appropriate cure55,56. The acute phase of hypoxic constriction of pulmonary blood vessels is endothelium-dependent57,58, and ultimately results from the activation of Rho kinase leading to calcium sensitization in the vascular smooth muscle59. It is enhanced by inhibitors of NOS and phosphodiesterase V60. Metallothionein, a protein responsible for zinc homeostasis, may also be involved, since zinc chelation inhibits the contractile response in pulmonary arteries61. As regards the sustained phase of hypoxic constriction in the pulmonary circulation, cyclic adenosine diphosphateribose (cADPR), a molecule that modulates the activity of ryanodine receptors, appears to be responsible62. Indeed, hypoxia increases the production of cADPR, which facilitates calcium release from the sarcoplasmic reticulum63. Furthermore, the cADPR antagonist, 8-bromo-cADPR, abolishes the sustained phase of the hypoxic response64. These changes work in conjunction with calcium sensitization (also induced by hypoxia51) to produce hypoxic constriction.


1) If you’re sleeping and your heart rate drops to say, the 40’s, is the SA node still the starting point for depolarization or does the AV start to play a role? I would assume the drop in HR is due to a decrease in conduction velocity and that the SA node is still the primary depolarizer.

2) An athletic heart beats slower due to the increased stroke volume, which is due to strengthening of the left ventricle. At what point does LVH become pathologic? Are extreme athletes more prone to left heart problems?    


A heart rate of 40 in a normal individual indicates sinus bradycardia due to lots of vagal tone lowering the slope of phase 4 of the node action potential.  Lance Armstrong had a resting heart rate of 32!  The bradycardia exists because of the larger stroke volume of enlarged hearts.  The resting cardiac output is normal so heart rate has to decrease.


Athlete's heart is considered benign but is similar to hypertrophic cardiomyopathy where the LV is also enlarged.  The difference is that halting training will lead to heart size returning toward normal in athletes.  Also HCM involves thickening of the septum and outflow tract obstruction so the imaging studies are different.

       Is the sum of partial pressures of gases in blood equal to total atmospheric pressure?

Not necessarily.  This is true for alveolar gas pressures but not for blood.  For practical purposes, liquids are incompressible and do not respond to changes in ambient pressure. Because of this, the sum of gas partial pressures in a liquid can be less than ambient pressure. Liquids such as blood and other body tissues will equilibrate only with the gas partial pressures to which they are exposed. 

On the alveolar side of the alveolar membrane, the total partial pressures must equal ambient pressure. However, on the liquid side of the membrane, the total partial pressures can be less, and in some areas may be quite a bit less than ambient pressure. The partial pressure that a gas exerts in a liquid depends on the temperature, the solubility of the gas in the liquid and the amount of gas present. Thus, if the amount of gas present and the temperature remain constant, the partial pressure of the gas in a tissue is fixed. If one gas is removed from a tissue, the remaining gases do not expand to fill the partial pressure vacated by the gas that was removed. The figure below shows total partial pressures for air breathing at 1 ATA from inspired gas to venous blood. Because of the decline in PO2 from alveoli to arterial blood, the total gas partial pressure in arterial blood during air breathing at 1 ATA is 752 mmHg, less than ambient pressure (760 mmHg). If PaO2 is lower than 95 mmHg (assumed in this example), then the total partial pressure in arterial blood will be less.


       Would the alveolar-arterial PO2 difference (A-a)PO2 be normal in a healthy person breathing 100% oxygen; i.e., would alveolar and arterial PO2 both increase by the same amount?

No, the (A-a)PO2 will be greatly increased in healthy lungs breathing 100% O2.  
The figure below shows inspired to venous blood partial pressures during O2 breathing at 1 ATA (100% O2 at sea level). In this example, it is assumed that all nitrogen, argon and other trace gasses have been washed out of the system. During O2 breathing, the ventilation/perfusion inequalities in lung have a much greater impact on PaO2 than during air breathing. Under optimal conditions during O2 breathing at 1 ATA, PaO2 would be about 500 mmHg while alveolar PO2 is about 663 mm Hg. (PAO2 = (760 - 47) - 40/.8 = 663). As blood moves through tissue, the same 4.5 mL O2/dL blood is extracted, and PO2 falls to 57 mmHg in venous blood. 

A look at the oxyhemoglobin dissociation curve helps explain why the (A-a)PO2 difference is so high. Because of the flat upper portion of the curve, a small drop in O2 content due to normal shunts and low V/Q cause a large drop in PO₂ (from PAO₂ = 663 to PaO₂ = 500 mm Hg.


I had a quick question on this image. Can you help me understand how the intrapleural pressure changes?
I understand that the pressure inside the alveoli changes during inspiration because the volume increases, thus pressure has to decrease. During expiration the volume decreases thus the pressure increases. 
I don't know the changes in the intrapleaural pressure. 


Answer: The yellow arrow is meant to show the elastic recoil pressure of the lungs.  I usually draw the arrow the other way since the lungs are "trying" to deflate (not get bigger🤔).  The alveolar pressure starts at zero (top figure).  it is always the sum of intrapleural pressure (starts at - 5) and elastic recoil pressure (starts at +5).  in drawing B, alveolar pressure is -1 because it equals -6.5 + 5.5 = -1.  and so on for the other drawing.
So the elastic recoil the same thing as transmural pressure. Should we just know that at rest our intrapleural pressure is at -5 and begin the cycle form there?

Yes for the alveoli it is the same thing. For the airway transmural pressure is pressure inside minus pressure outside.


Question: Why does increasing the hematocrit (polycythemia, blood doping) cause the diffusion capacity to increase across the alveolar membrane?

Is it because increasing the RBCs somehow increases the blood capillary volume? And if so, how? Aren't the capillaries only wide enough for one RBC at a time? How can increasing the number of RBCs going linearly though a capillary increase the blood volume at this junction?


Or is it because increasing the RBCs somehow affects the rate of O2-Hb binding? 

Answer:
Khan video on diffusion

Not mentioned in the video is the influence of capillary volume and hemoglobin.

Capillary volume is part of the surface area component of the Fick Equation and is influence by factors such as exercise which increases diffusing capacity by increasing blood flow to the top of the lungs and thereby increasing capillary volume = surface area for diffusion.


Passive diffusion proceeds at a rate proportional to the driving force (P1 – P2), surface area (A), and solubility of the diffusing gas (K) and inversely proportional to thickness of the barrier (T).  These factors comprise Fick’s law for passive diffusion, where K is Krogh’s diffusion constant. Because it is not possible to accurately measure area or thickness, these membrane properties along with K are lumped to form a parameter called diffusing capacity, DL.  As shown in the figure, the flow of gas by diffusion, in ml/min, = DL (P1 – P2).  Note that when P1 = P2, the driving pressure becomes zero and gas movement stops. This equation for gas flow can be rearranged to provide the equation for diffusing capacity:  DL = Vgas / (P1 – P2)

Hemoglobin concentration is important in the rate of diffusion because the final step in diffusion of oxygen is reaction with hemoglobin. Also, as described below, diffusing capacity is measured using carbon monoxide. The binding of CO to Hb goes faster with more Hb; e.g., anemia will reduced the measured diffusing capacity.

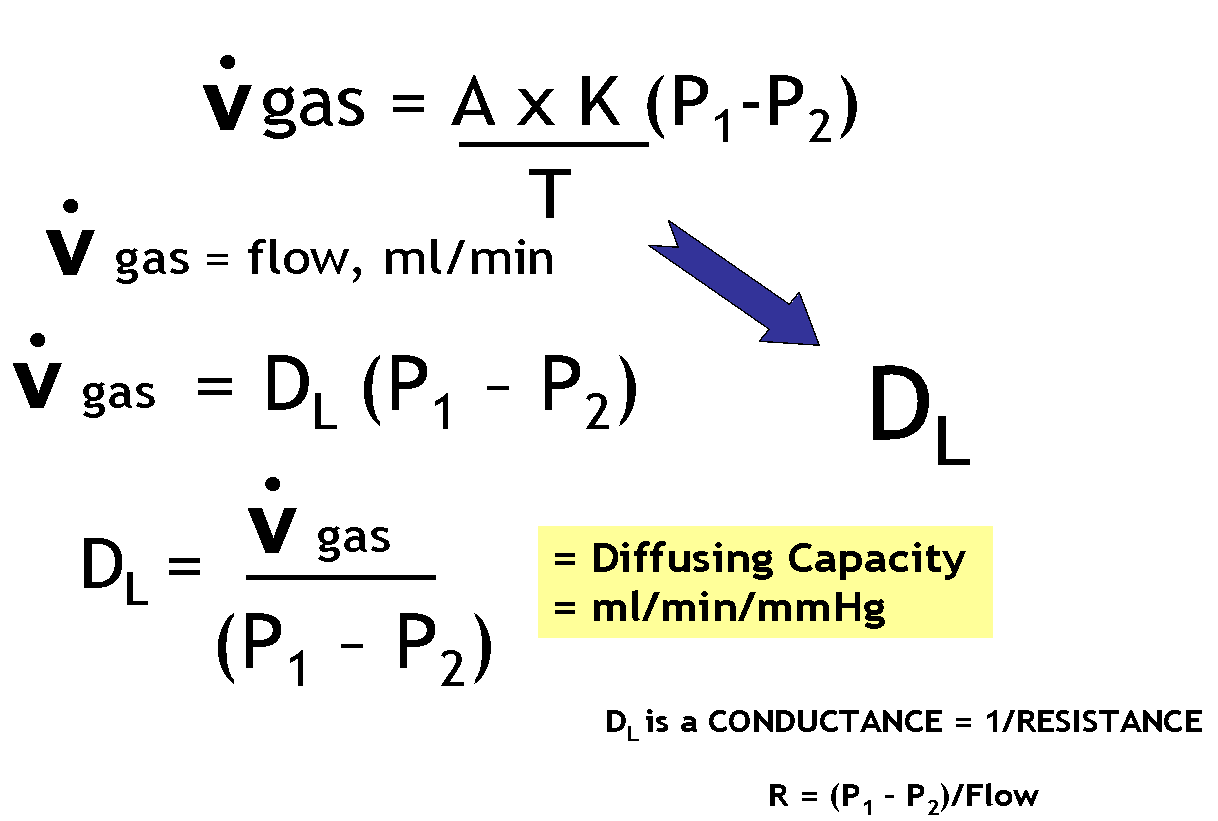
How is Diffusing Capacity Measured?


Carbon monoxide is used to measure diffusing capacity of the lung (DL).  Advantages of CO are that its uptake is limited by membrane properties (diffusion limited) and not by blood flow (perfusion limited).  This is so because CO gas binds 100% with hemoglobin meaning there is no back pressure (P2) to slow or stop diffusion.  Since P1 is kept constant, the rate of transfer depends only on DL.

https://www.openanesthesia.org/pulm-diffusing-capacity/

Pulmonary diffusing capacity is often measured by Diffusion capacity of the Lungs for carbon monoxide (DLCO). In essence, this measures how much CO can pass from the alveoli to the blood in the pulmonary capillaries, thus giving clinicians the broader idea of how much inhaled gas can pass into the blood through the lungs. 

While some state the “DLCO correlates with the total functioning surface area of the alveolar-capillary interface (Butterworth, et al),” Dr. McCormack notes, “Older textbooks suggest that thickening of the alveolar-capillary membrane (in interstitial lung disease) and loss of alveolar membrane surface area (in emphysema) are the primary causes of a low DLCO. However, subsequent experimental data suggest these and most other diseases that influence the DLCO do so by reducing the volume of red blood cells in the pulmonary capillaries” (McCormack). Regardless of theory, whether the surface area or the alveolar surface itself is modified or the volume of the blood in the pulmonary capillaries is modified, the DLCO reflects how much gas can be transferred to the blood via the lungs.


  1. Butterworth IV, JF, Mackey DC, Wasnick JD.  Morgan & Mikhail’s Clinical Anesthesiology, 5th ed. New York, NY: McGraw Hill; 2013.

  1. McCormack, Meredith. “Diffusing Capacity for Carbon Monoxide.” Ed. James Stoller and Helen Hollingsworth. N.p., 14 Apr. 2015. Web.


We had previously discussed the ability for Acetylcholine to vasoconstrict and vasodilate, depending on where it binds.  
We were wondering how Acetylcholine gets in the bloodstream, so as to bind to endothelial cells, and not the smooth muscle cells directly (which would induce vasoconstriction)? 


Remember that most blood vessels only get sympathetic innervation -  very few get cholinergic innervation.  


Acetylcholine (ACh), whether released by cholinergic autonomic nerves or exogenously administered, binds to muscarinic receptors on the vascular endothelium (muscarinic receptors in coronary vessels), which stimulates the formation and release of NO as described above to produce vasodilation. 


Production of nitric oxide (NO) by endothelial cells. NO is produced by the action of endothelial nitric oxide synthase (eNOS) on L-arginine. This reaction requires a number of cofactors, including tetrahydrobiopterin (BH4) and nicotinamide adenine dinucleotide phosphate (NADPH). Increased intercellular Ca++ in response to vasodilator agonists or shear stress displaces the inhibitor caveolin from calmodulin (CaM), activating eNOS. NO diffuses to vascular smooth muscle and causes relaxation by activating guanylate cyclase (GC), thereby increasing intracellular cyclic guanosine monophosphate (cGMP). Reprinted with permission from Behrendt D, Ganz P. Am J Cardiol. 2002;90(suppl):40L–48L.


I have a quick question about diastolic pressure. I was doing practice questions on Kaplan and one of the explanations said that mitral stenosis causes and increase in diastolic pressure and I'm a little confused on how. Would you be able to explain that to me?


 Mitral stenosis (red PV loop in figure) impairs left ventricular filling so that there is a decrease in end-diastolic volume (preload). This leads to a decrease in stroke volume (reduced width of PV loop) by the Frank-Starling mechanism and a fall in cardiac output. Reduced ventricular filling and reduced aortic pressure decrease ventricular wall stress (afterload), which may result in a small decrease in ventricular end-systolic volume; however, this is not sufficient to offset the reduction in end-diastolic volume. Therefore, because end-diastolic volume decreases more than end-systolic volume decreases, the stroke volume (shown as the width of the loop) decreases.


The changes described above and shown in the figure do not include cardiac and systemic compensatory mechanisms (e.g., systemic vasoconstriction, increased blood volume, and increased heart rate and inotropy) that attempt to maintain cardiac output and arterial pressure. Therefore, the red loop depicted in the figure only represents what may occur under a given set of conditions.

There are reports of hypertension in patients with mitral stenosis but a cause and effect relationship has not been established. "The blood pressure exceeded 150/90 mm. Hg in 33 of 200 cases of mitral stenosis. This incidence of 16'5 per cent was not significantly higher than in 200 control cases of the same sex and age. Hypertension in mitral stenosis is an essential hypertension in nearly all cases, and a renal origin is uncommon." 


I have a quick question about stroke work.


"A limitation of the relationship of stoke volume versus end-diastolic volume is that changes in either inotropic or afterload shifts the position of the curve.

if instead stroke work is plotted as a function of EVD, the position os the curve is independent of after load.

Stroke work is estimated as stroke volume times mean arterial blood pressure."


I understand the first part about shifting the curve for both inotropy and afterload, but i don’t understand what the graph for Stroke work is supposed to tell me. Its the same just with out after load? why do we remove after load?


I think the main factor is that stroke work incorporates pressure (afterload) so that there is no shift in the Starling curve due to changes in afterload (unlike the Starling curve that uses stroke volume vs end diastolic volume.


A limitation of the relationship of stroke volume versus end-diastolic volume (EDV) is that changes in either inotropic state or afterload shift the position of the curve. 
If instead stroke work is plotted as a function of EDV, the position of the curve is independent of afterload. 

Stroke work is estimated as stroke volume times mean arterial blood pressure. 

When stroke work is plotted versus EDV, the position of the Starling curve will only be shifted upwards or downwards by changes in the inotropic state.


Why is the partial pressure of oxygen called oxygen tension? This might be trivial to understand but I feel that it might help me understanding ABGs at a deeper level. I’ve looked online at the Dalton and Henry equations from physics but it seems that the term “tension” is exclusively for medicine. Do you know why that is?


Oxygen tension is the same as the partial pressure of oxygen. It isn't the same as the concentration of oxygen.

To explain this a little further we need to go to Dalton's law of partial pressures, which states that the total pressure of a mixture of gases (air is a great example since air is a mixture) is the same as the sum of the partial pressures of each of its constituents. The partial pressure is that pressure which would be exerted by the gas if it were there alone.

Let's do an example. Suppose you had a rigid container of a set volume. Any volume will do; say a metre cubed. Now suppose it contains air at 1 atmosphere pressure (101kPa). Now suppose we can somehow remove all the gases except nitrogen, without altering the volume of the container. The concentration of nitrogen is now 100%. The total pressure in the container has dropped to 78kPa.

If we start again but remove all the gases except oxygen, the same happens. The concentration of oxygen becomes 100%. The total pressure has fallen to 21kPa. Argon would leave us at about 1kPa.

The total pressure inside the container (when it contains air) is the sum of the partial pressure of nitrogen (78kPa) plus the partial pressure of oxygen (21kPa) plus the partial pressure of argon (1kPa) plus a few noble gases and carbon dioxide. It all adds up to 101.325kPa.

As it conveniently happens, atmospheric pressure at sea level is about 100kPa, which means that concentration (%) and partial pressure are very similar (and to all intents and purposes interchangeable), but this is only true at sea level.

If we increase the ambient pressure of atmospheric air to 2 atmospheres, the concentration of oxygen remains 21% by volume, but the partial pressure of oxygen will have doubled, to 42kPa.

So why bother? Because the behaviour of gases in physics and chemistry (as well as physiology) is far more related to its partial pressure than to its concentration. That's because partial pressure is all about number of molecules per unit volume. The formula for partial pressure is ambient pressure x concentration.

"Oxygen tension" is a more or less obsolete way of talking about partial pressure of oxygen. It means exactly the same.


I have another question, if a person had a Right to left shunt, I know that the Qp/Qs ratio would be less than 1 because there will be greater systemic flow. I was thinking about the V/Q ratio and so would I be right to say that the V and Q would both be decreasing but the Q would have a greater affect and so the V/Q ration would be greater than 1 for a Right to left shunt?


good question.  for a R-L shunt, the systemic Qs is higher but the pulmonary Qp is normal, so the V/Q is normal.


I have a question regarding mitral stenosis. I'm trying to practice some pv loops and I came across the mitral stenosis one and I'm confused as to why End Diastolic Volume would decrease with mitral stenosis.

When I was trying to work through it, I figured that the Left atria would have an increase pressure because it has to work harder to get blood through the stenotic valve, hence there is a greater pressure gradient between LA and LV. I thought that that would increase filling time and increase end diastolic volume but that's not how it is and I'm confused why. Sorry for the long question but I appreciate all your help!!


LV volume does decrease due to reduced LV filling.  Here is what the PV loop looks like.
Inline image 1


Question: Also, just to clarify, force of contraction does not mean contractility or do they mean the same thing? If they don't, could you please explain it to me and how contractility is specific to Ca2+ levels? 

Cardiac Inotropy (Contractility)


Changes in inotropy are an important feature of cardiac muscle because unlike skeletal muscle, cardiac muscle cannot modulate its force generation through changes in motor nerve activity and motor unit recruitment. When heart muscle contracts, all muscle fibers are activated and the only mechanisms that can alter force generation are changes in fiber length (preload; length-dependent activation) and changes in inotropy (length-independent activation). The influence of inotropic changes in force generation is clearly demonstrated by use of length-tension diagrams in which increased inotropy results increases active tension at a fixed preload. Furthermore, the inotropic property of cardiac muscle is displayed in the force-velocity relationship as a change in Vmax; that is, a change in the maximal velocity of fiber shortening at zero afterload. The increased velocity of fiber shortening that occurs with increased inotropy increases the rate of ventricular pressure development, which is manifested as an increase in maximal dP/dt (i.e., rate of pressure change) during the phase of isovolumetric contraction. Because of these changes in the mechanical properties of contracting cardiac muscle, an increase in inotropy leads to an increase in ventricular stroke volume.

Effects of Inotropy on Frank-Starling Curves

Inotropic effects on Frank-Starling relationship
By altering the rate of ventricular pressure development, the rate of ventricular ejection into the aorta (i.e., ejection velocity) is changed. Because there is finite time available for ejection (~200 msec), changes in ejection velocity alter the stroke volume - increased ejection velocity increases stroke volume, whereas reduced ejection velocity decreases stroke volume.
A decrease in inotropy shifts the Frank-Starling curve downward (point A to B in the figure). This causes the stroke volume (SV) to decrease and the left ventricular end-diastolic pressure (LVEDP) and volume to increase. The change in SV is the primary response, whereas the change in LVEDP is a secondary response to the change in SV. This is what occurs, for example, when there is a loss in ventricular inotropy during certain types of heart failure. If inotropy is increased (as occurs during exercise), the Frank-Starling curve shifts up and to the left (point A to C in the figure), resulting in an increase in SV and a decrease in LVEDP. Once a Frank-Starling curve shifts in response to an altered inotropic state, changes in ventricular filling will alter SV by moving either up or down the new Frank-Starling curve.

Effects of Inotropy on Ventricular Pressure-Volume Loops

Inotropic effects on pressure-volume loop
The reason why LVEDP falls when SV is increased can best be shown using left ventricular (LV) pressure-volume loops (see figure). In this figure, the control loop has an end-diastolic volume of 120 mL and an end-systolic volume of 50 mL. The width of the loop (end-diastolic minus end-systolic volume) is the stroke volume (70 mL). When inotropy is increased (at constant arterial pressure and heart rate) SV increases, which reduces the end-systolic volume to 20 mL. This is accompanied by a secondary reduction in ventricular end-diastolic volume (to 110 mL) and pressure because when the SV is increased the ventricle contains less residual blood volume after ejection (decreased end-systolic volume), which can be added to the incoming venous return during filling. Therefore, ventricular filling (end-diastolic volume) is reduced. The dotted lines for the two loops represent the end-systolic pressure-volume relationship (ESPVR). The ESPVR is shifted to the left and its slope becomes steeper when inotropy is increased. The ESPVR is sometimes used as an index of ventricular inotropic state.
Changes in inotropy produce significant changes in ejection fraction (EF, calculated as stroke volume divided by end-diastolic volume). In the previous figure, the control EF is 0.58 and increases to 0.82 with increased inotropy. Therefore, increasing inotropy leads to an increase in EF. In contrast, decreasing inotropy decreases EF. Therefore, EF is commonly used as a clinical index to assess the inotropic state of the heart. In heart failure, for example, there often is a decrease in inotropy that leads to a fall in stroke volume as well as an increase in preload, thereby decreasing EF.
Changes in inotropic state are particularly important during exercise. Increases in inotropic state help to maintain stroke volume at high heart rates and elevated arterial pressures. Increased heart rate alone decreases stroke volume because of reduced time for diastolic filling, which decreases end-diastolic volume. Elevated arterial pressure during exercise increases afterload on the heart, which tends to reduce stroke volume. When the inotropic state increases at the same time, end-systolic volume decreases so that stroke volume can be maintained and allowed to increase despite reduced time for ventricular filling and elevated arterial pressure.

Factors Regulating Inotropy

factors determining ventricular inotropy
The most important mechanism regulating inotropy is the autonomic nervesSympathetic nerves play a prominent role in ventricular and atrial inotropic regulation, while parasympathetic nerves (vagal efferents) have a significant negative inotropic effect in the atria but only a small effect in the ventricles. Under certain conditions (e.g., exercise, stress and anxiety), high levels of circulating epinephrineaugment sympathetic adrenergic effects. In the human heart, an abrupt increase in afterload can cause an increase in inotropy (Anrep effect). An increase in heart rate also stimulates inotropy (Bowditch effect; treppe; frequency-dependent inotropy). This latter phenomenon is probably due to an inability of the Na+/K+-ATPase to keep up with the sodium influx at higher heart rates, which leads to an accumulation of intracellular calcium via the sodium-calcium exchangerSystolic failure that results from cardiomyopathy, ischemia, valve disease, arrhythmias, and other conditions is characterized by a loss of intrinsic inotropy.
In addition to these physiological mechanisms, a variety of inotropic drugs are used clinically to stimulate the heart, particularly in acute and occasionally in chronic heart failure. These drugs include digoxin (inhibits sarcolemmal Na+/K+-ATPase), beta-adrenoceptor agonists (e.g., dopamine, dobutamine, epinephrine, isoproterenol), and phosphodiesterase inhibitors (e.g., milrinone).

Mechanisms of Inotropy

Most of the signal transduction pathways that stimulate inotropy ultimately involve Ca++, either by increasing Ca++ influx (via Ca++ channels) during the action potential (primarily during phase 2), by increasing the release of Ca++ by the sacroplasmic reticulum, or by sensitizing troponin-C (TN-C) to Ca++.


Question: Could you please explain to me how calcium channel blockers treat hypertension?

Answer. There are different classes of calcium channel blockers but in coronary and peripheral arterial smooth muscle and the heart, inhibition of Ca2+ channels blocks the entry of Ca2+ into cells and blunts the ability of Ca2+ to serve as an intracellular messenger. Therefore, calcium-channel blockers are smooth-muscle dilators and have a negative inotropic effect (decrease the force of contraction of the heart).  both these effects cause a decrease in blood pressure.


Question: If there's an increase in insulin and K+ goes into the cell and there's hypokalemia which leads to a hyperpolarized resting membrane potential, why would the excitability increase? On your blog it says...
Dec. K+ = Increase size of Na+channels = more rapid Na+ influx in phase zero = more excitable)
but I'm not understanding what "increase size of Na+ channels" means and how that happens from hypokalemia.


Answer. Thanks for your question.  It prompted me to re-write that section of the blog to try and clarify.  It's really the number of sodium channels, not the size, that is important.
    • Alkalosis leads to shift of K+ into cells = more negative Em (-80 to -90 mV) (by itself this might make the cell less excitable but the threshold for action potentials also become more negative.
    • However, cells are more excitable because the rate of rise of phase 0 of the action potential (Vmax) is directly proportional to the value of the resting membrane potential at the onset of phase 0. This is because the membrane potential at the onset of depolarization determines the number of sodium channels activated during depolarization, which in turn determines the magnitude of the inward sodium current and the Vmax of the action potential.


    • Shift of H+ out of cells leads to increased protein negatively charged binding (Pr-) sites inside cells and in plasma = increased Ca++ binding to these negative sites = decreased contractility

    • Net effect = increased excitability, cardiac arrhythmias; muscle weakness


Question: What about the calcium question with sol. A = 10 mM and sol. B = 1 mM. Which form of the Nernst equation should be used, -61 or + 61?

Answer: That question shows high calcium in Solution A and low calcium in Solution B.  For this to be stable, Solution A must be negative to Solution B to counteract the concentration driving force.  For the Nernst equation, you can calculate it either as +61 x log [X]out/[X]in  OR  -61 x log [X]in/[X]out.  For most ions, Xin is > Xout so you get a number greater that 1 (makes the math a little easier than working with log of decimals).  But either way gives you the same answer.


Asthma

Question

When as pt has and asthma attack due to it being an obstructive problem , I thought the pt would be hypercapnic .. The PBL had the ABGS that showed hypocapnic. I dont follow the rational. Also, when A beta 2 agonist is given , does it initially cause hypoxemia because the vessels were vasodilated and when the beta agonist was given it caused vasoconstriction and this caused a Ventilation/respiration mismatch? 

Answer
the asthma attack caused a big-time mismatch in V/Q  by lowering V to alveoli downstream from constricted and mucus filled airways.
this caused a drop in arterial PO2
this caused stimulation of carotid PO2 receptor leading to hyperventilation (= decreased PCO2).  this would increase PO2 but not enough to compensate for the regions of the lung with low V/Q.
An arterial PO2 < 60 is defined as respiratory failure.  there are two types of respiratory failure:
type 1 = PO2 < 60 with normal or low PCO2 (patients can hyperventilate in response to hypoxia but still have low PO2)
type 2 = PO2 < 60 with high PCO2 (patients are unable to increase ventilation enough to lower PCO2)
memory tool:  type 2 = CO2
A beta 2 agonist may initially cause a drop in saturation by dilating arterioles more than airways, thus worsening V/Q mismatch.


Potassium
I'm finding a few little discrepancies between the currents discussed in class and those in Physiology by Costanzo, and was wondering what to go by. For example, regarding Phase 3, Costanzo never mentions an I(k1), only an I(k), but we had talked about both in class for this phase. Also for phase 4, Costanzo says for action potentials in the ventricles and atria, there is an outward I(k1) current and inward i(Na) and i(Ca-T), but in class we said it was an outward i(k) and inward i(Ca-T) and i(f). The only time Costanzo mentions i(f) is with the SA node action potential. Are these differences really important?


Answer
    In contractile myocytes that exhibit fast-response action potentials and a stable phase 4, membrane permeability to potassium is high, largely due a high open probability of inwardly rectifying K channels (these channels carry the IK1 current).  Consequently, phase 4 membrane potential is close to the K equilibrium potential, and there is only a small outward K current.  Permeability to Na+ and Ca2+ is very low, so the inward currents associated with these ions are small.  Neither T-type channels nor channels that mediate the funny current (if) in pacemaker cells are involved here.
      In pacemaker cells (e.g. SA node), there are 3 primary currents that are responsible for the phase 4 pacemaker potential:
        a. An inward current (if) carried mainly by Na+.  
          b. An inward Ca2+ current (iCa) that becomes activated toward end of phase 4, mediated by both L-type and T-type VGCC.  L-type channels are activated near the end of phase 4 and contribute not only to this pacemaker potential, but also phase 0 (i.e. upstroke of the action potential; see attached review). These L-type channels are also those activated by catecholamines, which increase the inward Ca2+ current, thereby increasing the slope of the pacemaker potential.
            c. A decreasing outward K+ current (iK) due to inactivation of Kdr (delayed rectifier K channels).
              Although not mentioned in current physiology texts, there is also evidence that the sodium calcium exchanger plays an important role in the pacemaker potential by mediating an inward Na+ current (I think this is also mentioned in the attached review).  Also note that the statement in Costanzo that T-type calcium channels mediate phase 0 of the slow response action potential is a mistake.  T-type channels may be involved in the phase 4 pacemaker potential, but not phase 0, as Dr. Partridge mentioned.  Inward calcium current through L-type channels predominantly mediates the upstroke of the action potential in pacemaker cells.
                Regarding phase 3:
                  In a fast response action potential, the rapid repolarization during phase 3 is caused by inactivation of the L-type Ca2+ channels and a relative increase in K+ permeability [mediated primarily via activation of delayed rectifier K+ channels (iK) and inwardly rectifying channels (iK1) ].
                    For slow-response action potentials, phase 3 is primarily mediated by increased outward K+ current (iK) due to activation of Kdr.
                      SVT vs. VT

                      Regarding the question which begins "This EKG was obtained from a 77 year old woman who was recently admitted to the Coronary Care Unit for an acute inferior myocardial infarction...." the question is accompanied by an EKG which shows a narrow complex tachycardia without discernable p-waves. It appears to have left axis deviation (Up in I, Down in aVF). The V leads are not concordant. The answer is keyed as V-tach, not SVT. If this is VT, what did I miss?

                      Answer 1
                      I can see why this is confusing. Looking at the QRS complexes they are not as wide and bizarre looking as we usually see in VT although they are definitely widened a little. The thing that really makes it VT is the AV dissociation with the appearance of p waves independent of the QRS complexes (indicated by the arrows). You cannot have AV dissociation with SVT because the atria (and SA node) are depolarized at the same rate as the ventricle, around 150 times/minute. That means that the SA node would never get a chance to depolarize normally and cause a p-wave. 


                      Answer 2
                      In short, SVT is an "above the ventricle" arrhythmia. Typical SVTs include: A-Fib, A-Flutter, AVRT, or AVNRT. VT is a ventricular initiated arrhythmia. This rhythm is often a medical emergency as it may digress to VF and significantly compromise systemic perfusion.


                      On the ECG one could often distinguish between the two by looking at the width of the QRS complexes. VT will be very broad suggesting ventricular delay, SVT tends to be narrow.


                      In the example question given the QRS complexes appear to be >100 msec (wide) but this is not clear given no little box detail and no print out of intervals. 


                      Rho Kinase

                      I just have a quick question I'm having a hard time answering. Does the RhoA/ROCK pathway stimulate or inhibit the MLCP pathway?

                      Answer

                      Activation of the RhoA-ROK pathway mediates increased smooth muscle Ca2+ sensitivity by inhibition of MLCP, and provides a major contribution to receptor-mediated Ca2+-sensitization of smooth muscle. Such inhibition of MLCP results in accumulation of phosphorylated MLC and thus greater contraction for a given [Ca2+]i.  

                      Myocyte Action Potentials and Ion Conductance

                      summative 2 had MCQ on this.  Figure was flawed.  Here is an accurate figure


                      Answer
                      "I think that the scale on the "Ion Conductivity" axis is incorrect. At the end of phase 4, all conductances shouldn't be the same. (It looks sort of like the figure is showing current rather than conductance.) In a graph of conductance, gK should be high, it falls during phase 0 and gradually rises again during phase 2 and 3. gNa is transient during phase 0 as shown and L-type gCa is at a peak during phase 2. Further confusing is the time scale, which is compressed with respect to that of the action potential. The figure below from makes this point. (This image is fromhttp://www.cvpharmacology.com/antiarrhy/cardiac_action_potentials.htm, which along with it's links, provides a pretty clear description of the cardiac action potential.)

                      4 comments:

                      Anonymous said...

                      Thank you for the good writeup. It in truth used to be a enjoyment account it.
                      Glance advanced to far brought agreeable from you!

                      However, how can we keep in touch?

                      Anonymous said...

                      Hi there, I enjoy reading all of your article.
                      I like to write a little comment to support you.

                      SW said...

                      thanks

                      SW said...

                      test